News literacy

The most useful response to an urgent headline is often a short pause. Here is how to make that pause count.

Search results reveal where an image has appeared, but the oldest indexed match may still be a repost, crop or copy of an earlier source.

A ratio describes one value relative to another. Its direction can look favourable even when the numerator and denominator both decline.

A verification code proves control of your device. A caller asking for it may be trying to complete a sign-in or account reset in your name.
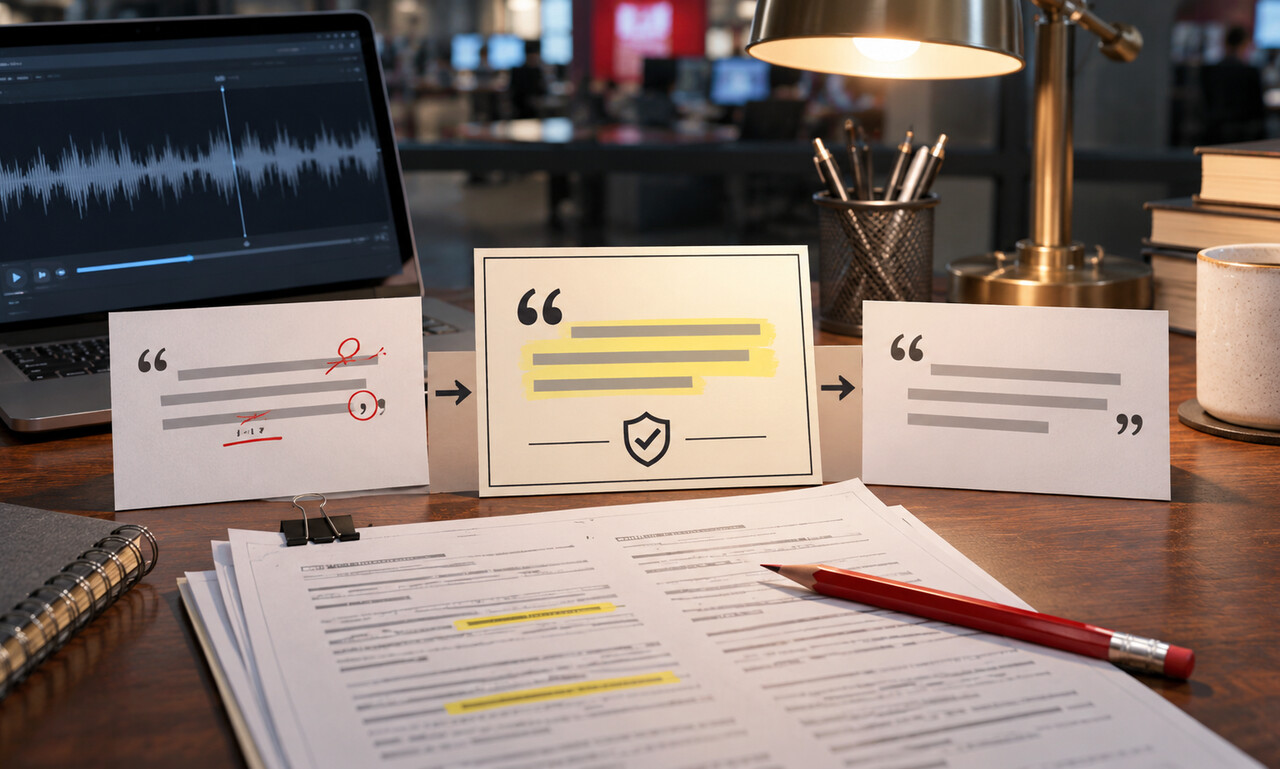
Minor edits can improve readability, but changing uncertainty, emphasis or grammar too heavily can turn a real quotation into words the person never gave.

Starting a bar chart above zero stretches modest gaps across the plotting area, making similar values appear dramatically different.

A horizontal flip can move signs, traffic and landmarks to the wrong side, creating false location clues even when the underlying scene is genuine.

Annualizing extends a shorter period as though its pace continued for a full year. It is a projection for comparison, not a count already recorded.

Encryption can protect files on a lost computer or phone, but an unlocked session may already hold the keys needed to read them.

No response can have many explanations. Reporting should document the contact attempt without claiming that silence proves the allegation.

Two vertical scales can be adjusted until unrelated lines appear to rise and fall together. The alignment may come from the axes rather than the data.

A clip may show a real moment while excluding the people, actions or surroundings needed to understand why it happened.

An increase above 100 percent means the added amount is larger than the starting value—not that the result has exceeded some universal maximum.

The registered domain sits immediately before the first slash, and misleading words placed farther left may belong only to a deceptive subdomain.

When a claim remains disputed or unproven, the headline must make that status visible instead of presenting the accusation as a settled conclusion.

Only the segments sharing a common baseline are easy to judge. Categories floating in the middle can look similar even when their values differ.

Real audio or video can be rearranged, shortened or separated from context until it appears to tell a story the full recording does not support.

A moving window makes a noisy series easier to read, but the smoother line responds later when the underlying direction changes.

A strong vault needs a safe route back in after a lost device or forgotten passphrase—without creating an easier route for an intruder.

Seeking comment is more than sending a last-minute message. The subject must understand the important claims and have a realistic chance to answer.

On a logarithmic axis, equal distances represent equal ratios rather than equal amounts—a useful view that changes how growth appears.

Statements show what an institution says happened. Reporting must still test the facts, context and competing accounts.

A large dataset can still mislead when the people included differ from the people the conclusion describes.

Encrypted websites reduce what nearby observers can read, but the network and the device still require careful choices.

The fact that a name is available does not always mean publishing it will improve the public’s understanding.

One shows everything recorded so far. The other shows how quickly the total is moving now.

A cropped page can hide headers, footnotes and surrounding language that determine what the document means.

Both describe position in a distribution, but one marks the middle while the other shows how a value compares with the rest.

Temporary needs can leave lasting access to location, contacts, photos and microphones long after a task ends.

Readers need relevant relationships before they evaluate an argument, not after they have already accepted it.

Per person is only part of the denominator. The length of observation can change the comparison completely.

A polished announcement can resemble a news story, but the source, purpose and unanswered questions are different.

Nothing happened and nothing was recorded are not the same result. Data codes can hide that difference.

A second step improves account security, but fake sign-in pages and approval fatigue can still defeat weaker methods.

A short note can explain an unusual decision, a reporting limit or a risk that ordinary article labels cannot show.

A single position can combine dozens of measurements, weights and missing values into one deceptively simple number.
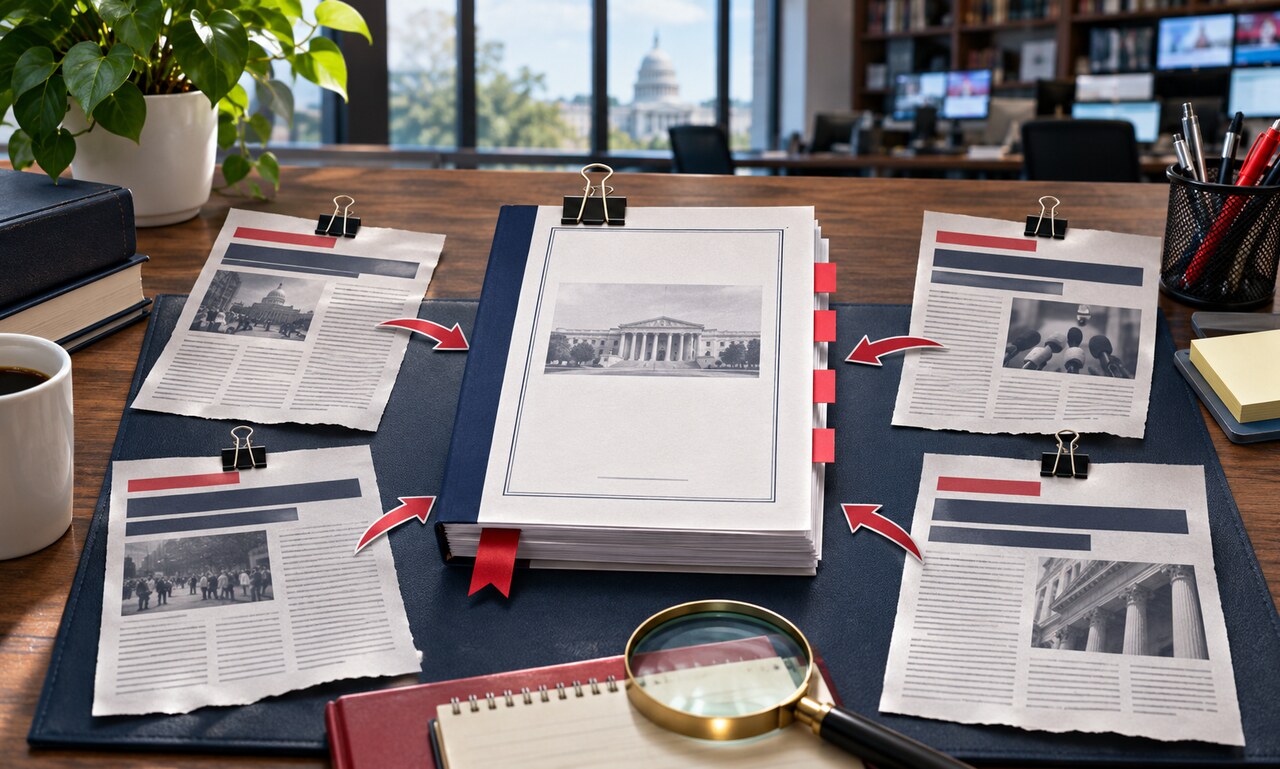
A report about a report is useful, but the original document shows what was actually measured, decided or said.

A percentage increase needs its starting point. Absolute numbers show how many people or cases are actually affected.

When the same password protects several accounts, a leak from one service can unlock doors elsewhere.

One identifies who reported the story. The other traditionally tells readers where that reporting was filed.

Early estimates provide speed. Revisions provide completeness. The label tells readers which tradeoff they are seeing.

A video may show something real while leaving the location, timing and wider event unresolved.

A result can look highly accurate and still produce surprising mistakes when the underlying event is rare.

Private mode limits what stays on your device, but it does not erase every record created beyond it.

Protecting a source may be necessary, but the article still owes readers enough context to judge the claim.

Small changes in order, tone and response options can move a survey result before anyone answers.

A quote card can travel farther than its original context. Four checks can show whether the words, speaker and meaning still line up.

A dramatic percentage can rest on very few observations. Sample size helps reveal how much confidence a result deserves.

File details can support an investigation, but missing or editable metadata should never carry the whole argument.

New facts and repaired errors serve different purposes. Clear labels help readers understand how a story changed.

Scale, projection, boundaries and labels shape what a map appears to say. Read the design before accepting the message.
A clearer picture, one explanation at a time. Selected videos from TED-Ed.
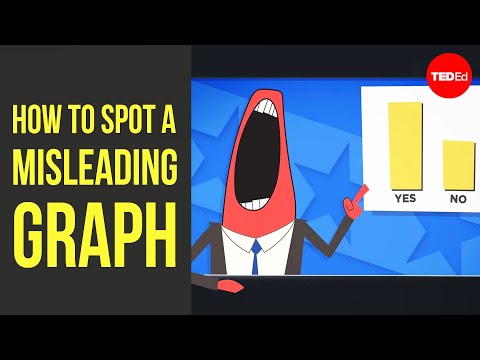
TED-Ed · Lea Gaslowitz
Watch on YouTube ↗
TED-Ed · Damon Brown
Watch on YouTube ↗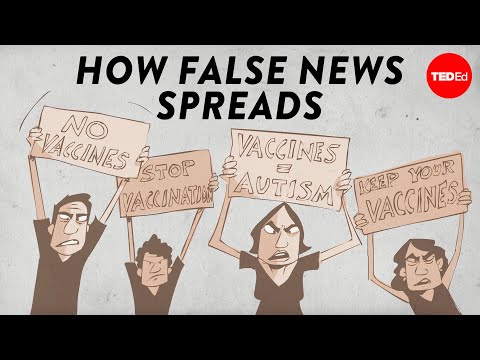
TED-Ed · Noah Tavlin
Watch on YouTube ↗




101 original articles. Practical explanations. Transparent perspectives.
Read our editorial standards →