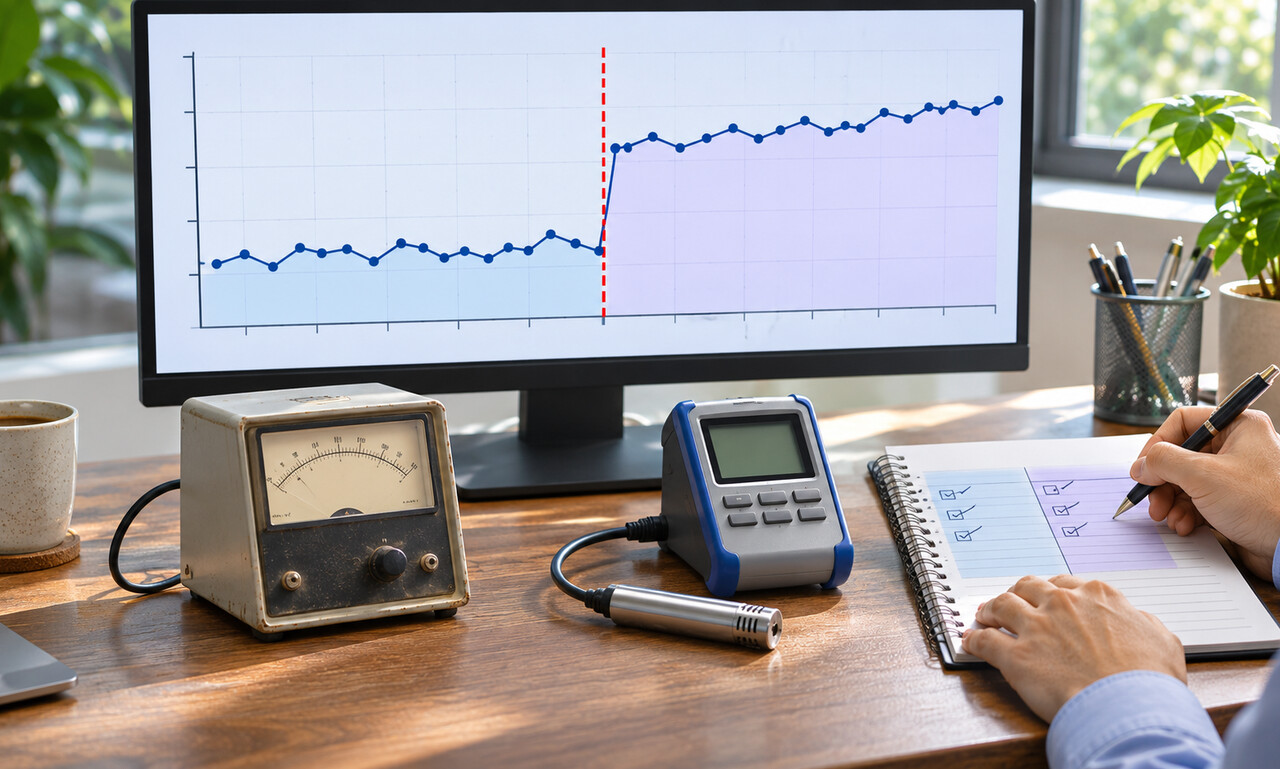
Time series assume that each period measures the same concept in a comparable way. When the method changes, the line may jump or bend because the measurement changed rather than because the real world did.
Examples include a revised survey question, a more sensitive test, a new administrative definition or a reporting system that captures cases previously missed. Each can improve accuracy while breaking direct comparison with older values.
Method notes should identify the transition date and whether the source recalculated earlier periods. Some agencies run old and new systems in parallel for a time, creating an overlap that estimates how much of the difference comes from the switch.
Do not automatically remove the jump or treat one method as wrong. The new series may be better for current decisions, while the old series remains the only evidence for earlier years. The key is to avoid interpreting the discontinuity as a natural event.
Mark the break visibly on charts and compare trends within consistent segments. A long line is meaningful only when readers can see where its ruler changed.
Original educational commentary by Breaking Click. This explainer is designed to help readers evaluate information more carefully.