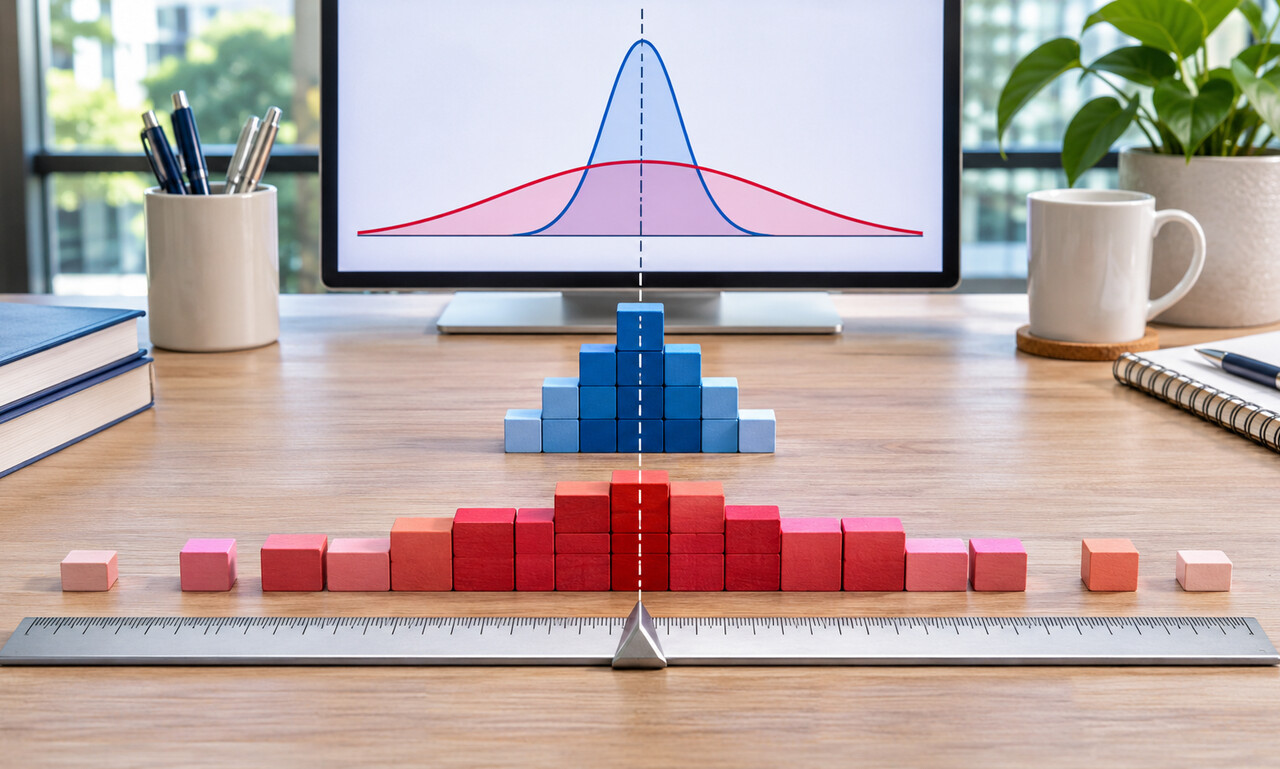
An average describes the centre of a dataset, not how far individual values sit from that centre. Groups with the same mean can produce very different experiences if their values are distributed differently.
Consider the sets 49, 50 and 51 versus 10, 50 and 90. Both average 50, but the second spans a much wider range. A person drawn from the first group is likely to be near the mean; a person drawn from the second may be far away.
Range shows the distance between the minimum and maximum, but it depends heavily on extremes. Measures such as standard deviation or the interquartile range describe spread more systematically. The best choice depends on the distribution and the question.
A widening spread can matter even when the average remains stable. Income, waiting times, test scores or regional outcomes may become less consistent, creating more very high and very low results that cancel in the centre.
Show the distribution when variation affects the story. Dot plots, box plots and percentile summaries reveal what one average cannot. A stable mean should not be mistaken for stable conditions across the whole group.
Original educational commentary by Breaking Click. This explainer is designed to help readers evaluate information more carefully.