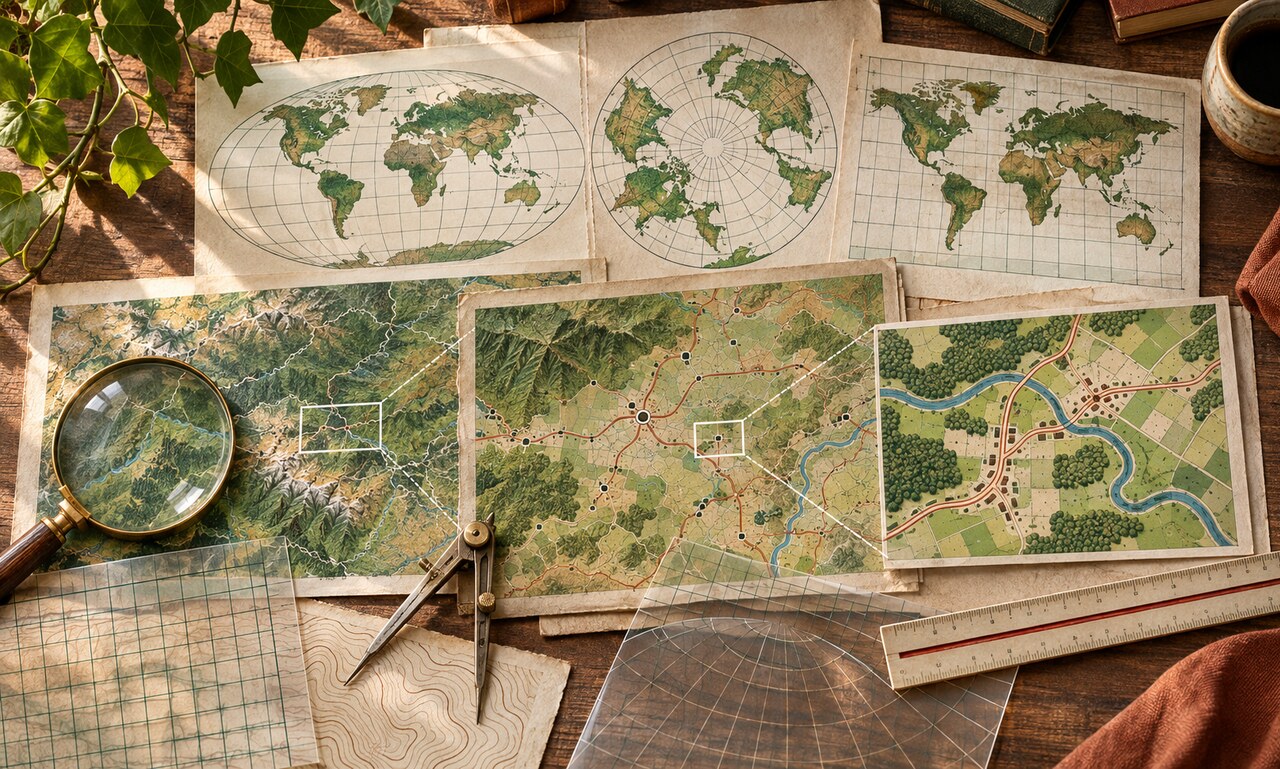
Maps look factual because they place information on familiar geography. But every map is a set of choices. It selects an area, a scale, a projection, boundaries, labels and visual emphasis. Those choices can clarify a pattern—or make one interpretation feel inevitable.
Start with scale. A national map may hide sharp differences between neighborhoods, while a tightly cropped local map can remove the wider context. Ask what sits just outside the frame and whether the unit of analysis matches the claim. County, district and postal boundaries can produce very different patterns from the same underlying data.
Projection matters on world maps because a curved surface must be flattened. Some projections preserve direction, some area and some shape, but none preserve everything. A familiar design may make places near the poles appear much larger than they are. When size is part of the argument, compare an equal-area view.
Then inspect color and categories. A dramatic red can make a modest difference feel like a crisis. Wide ranges can hide variation; narrow ranges can exaggerate it. Check the legend, the number of observations behind each area and whether the map shows totals, rates or percentages.
Finally, notice names and borders. Labels can imply recognition, ownership or importance, and disputed boundaries may be drawn as settled facts. A careful map explains its conventions and data source. A careful reader treats the map as an argument to examine, not simply a window onto the world.
Original educational commentary by Breaking Click. This explainer is designed to help readers evaluate information more carefully.