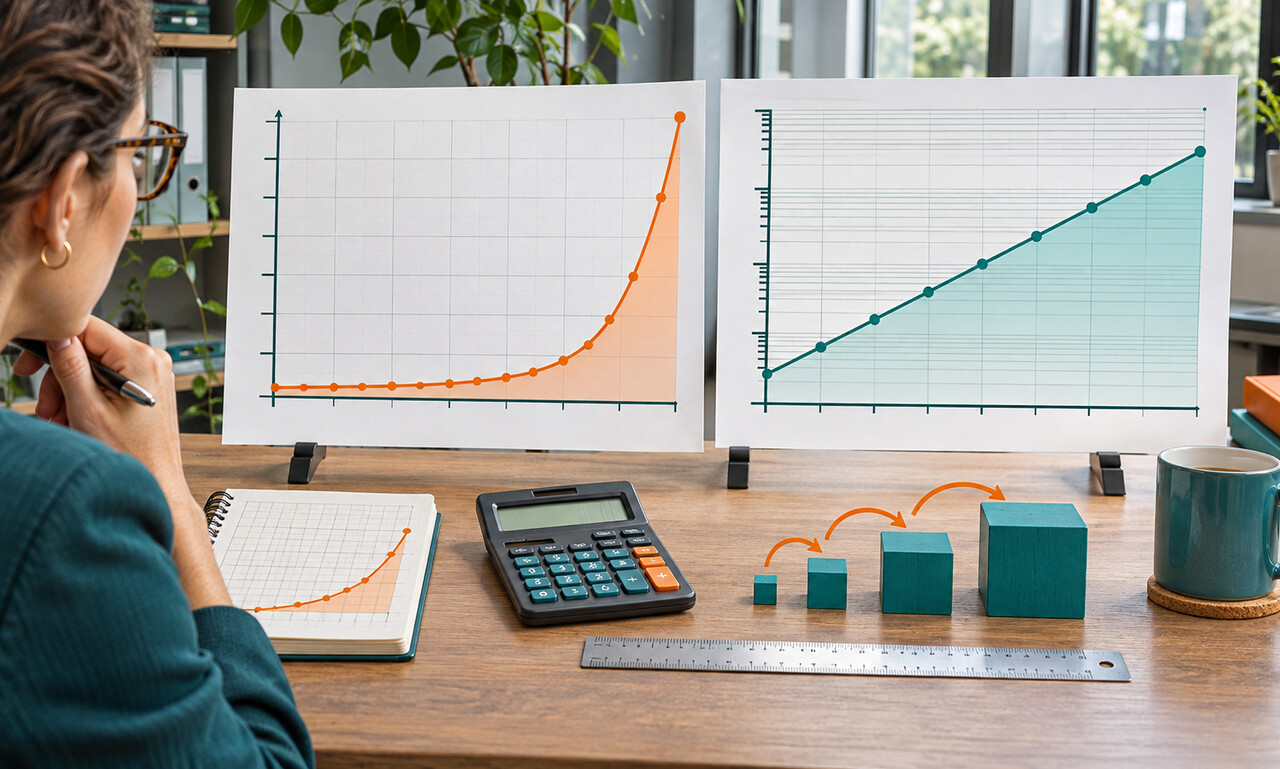
Most familiar charts use a linear axis: moving from 10 to 20 covers the same distance as moving from 110 to 120 because both add 10. A logarithmic axis works differently. Equal distances represent multiplication by the same factor, such as 10 to 20 and 100 to 200.
This makes equal percentage changes look equal. Doubling from a small base occupies the same vertical distance as doubling from a large base, even though the second change adds far more units. Exponential growth often becomes a straighter line and wide ranges fit into one frame.
Compression can also surprise readers. A rise of 100 units may look modest near the top of the chart and dramatic near the bottom because the scale emphasizes proportional movement. Tick labels may progress 1, 10, 100 and 1,000 rather than in equal arithmetic steps.
Neither scale is universally better. Use a linear view when absolute changes, capacity or total burden are the question. Use a logarithmic view when comparing growth rates, ratios or series whose magnitudes differ greatly. Showing both can reveal how the choice affects the impression.
The scale should be named prominently, and values at important points should be available. Before interpreting the slope, inspect the axis labels. On a logarithmic chart, a straight line signals a steady percentage rate—not a steady number of units added each period.
Original educational commentary by Breaking Click. This explainer is designed to help readers evaluate information more carefully.