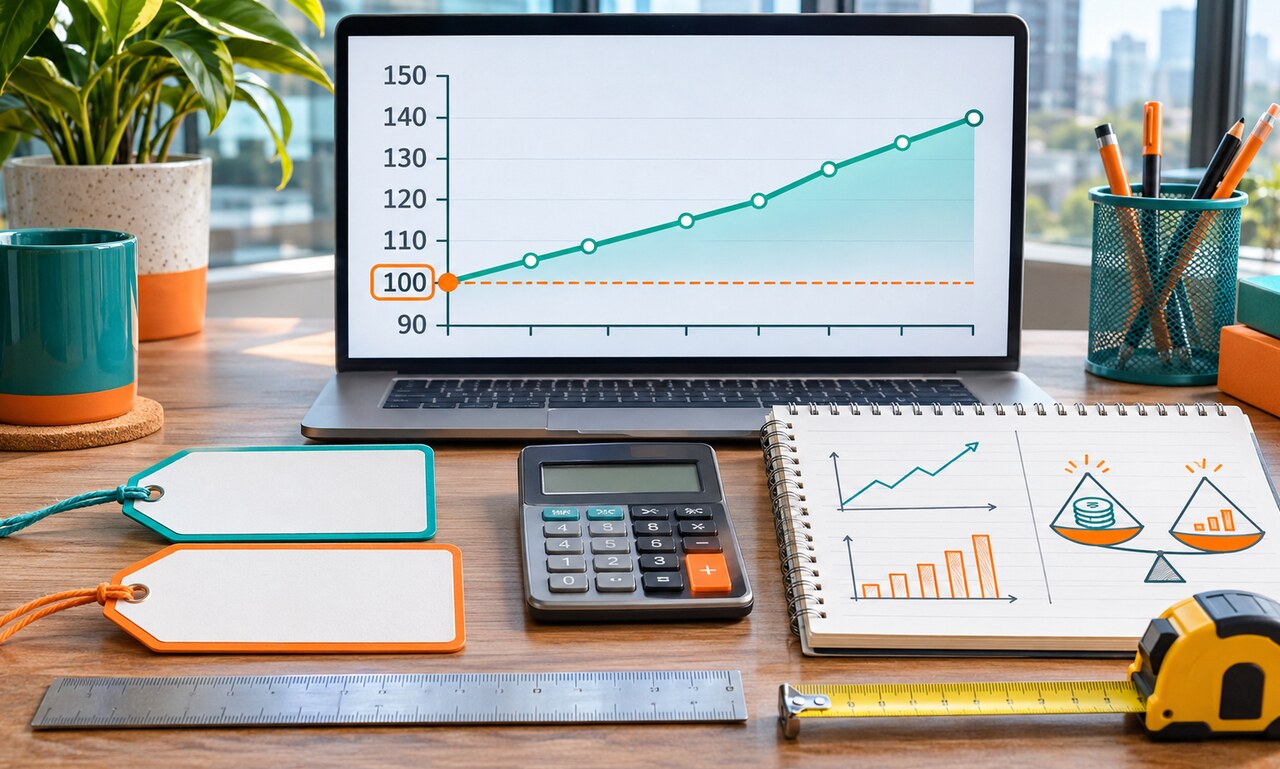
An index turns a starting value into a common baseline, often 100. Later values show movement relative to that starting point. An index of 120 usually means a 20 percent rise from the base period, not that the item costs 120 dollars or contains 120 units.
This approach makes unlike series easier to compare. Prices, wages and production can be placed on the same visual scale even when their original units are different. The convenience comes with a tradeoff: the chart may no longer show the actual starting amounts.
The base period shapes the appearance of the series. Two lines can begin together at 100 even if one represents a large amount and the other a small one. Changing the base year does not alter the underlying growth, but it can change which part of the story receives attention.
Composition also matters. Consumer price indexes combine many goods and services using weights. A household’s experience can differ from the headline index when its spending pattern is different. The index is a summary, not a receipt for every person.
Before interpreting an indexed chart, find the base period, the original measure and the weighting method. Translate key points back into percentage changes when possible. The index shows direction and relative movement; it does not replace the underlying amount.
Original educational commentary by Breaking Click. This explainer is designed to help readers evaluate information more carefully.