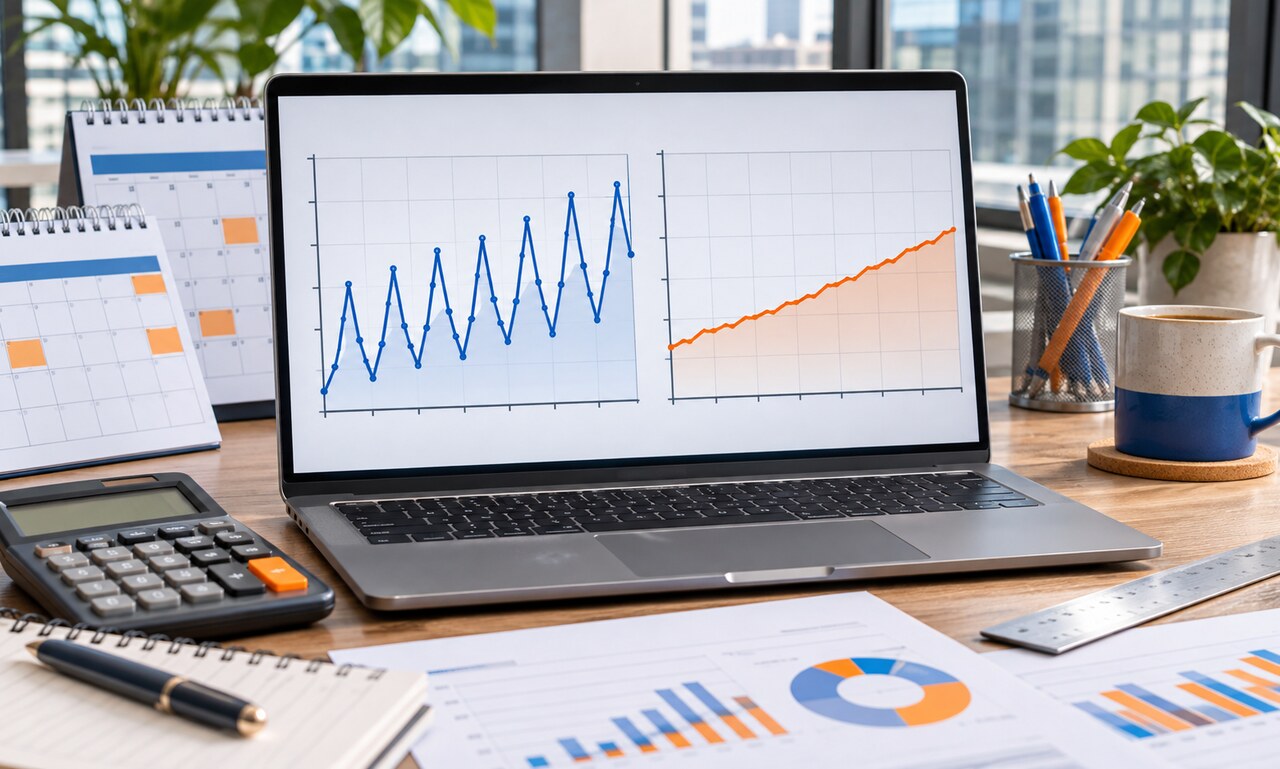
Many numbers rise and fall at predictable times of year. Retail sales jump before holidays, hiring changes during school breaks and energy use shifts with the weather. Comparing one month with the month before can mistake a normal seasonal pattern for a new trend.
Seasonal adjustment estimates and removes recurring calendar effects. The adjusted series helps analysts compare neighbouring periods on a more even basis. It answers a question such as: what changed beyond the pattern we normally expect at this time of year?
Raw data answers a different question. It shows the amount that was actually counted in the period. Businesses planning staff, governments delivering services and households watching bills may need those real totals even when the pattern is expected.
Adjusted figures are estimates, not a second set of observations. Agencies revise them as more data arrives and as seasonal patterns change. A disruption can also make the old pattern less reliable, so the method and revision history deserve attention.
Check the label before comparing numbers. Use adjusted data to study short-term movement and raw data to understand actual volume. For longer comparisons, match the same month across years or explain why the selected series fits the question.
Original educational commentary by Breaking Click. This explainer is designed to help readers evaluate information more carefully.